
knowledge reigns supreme, over nearly everybody
5/5/2015
I have been spending way too much time recently thinking about how I can convey the importance of data systems to you, my loyal readership. It’s the most important tool a team has in making strides in performance, diagnosis, and reliability. That’s really the best thing I can come up with. It’s used in EVERY professional race series, regardless of category. If that’s not enough to sway you toward a data system, then I’ll continue to ramble about it below.
I am in an interesting position in that I do private label work for a number of shops, teams, and individual customers. Basically, I get to see a lot of different stuff. I’ve done data analysis for a NASCAR Sprint Cup team, I’ve done analysis work for club level road racers, snowmobiles, drag racers, and a whole load of high performance street cars. The thing that all of these groups and categories have in common is that they all require some type of way to review and analyze data. Engine mapping, troubleshooting, and performance are all quantified and adjusted based around data. This all sounds super great, right? It is. Super great. But, it seems that there is a disconnect when it comes time for my customers to purchase one of these systems. Here are two problems that I’ve noticed over time.
The perceived gain problem.
There is a big problem with the understanding behind purchasing data systems. The problem, as far as I see it, is that there’s no direct connection in a customer’s mind behind purchasing a data package and performance gained.
For instance, customer A wants to buy a turbocharger that has a 50lb/min max flow rating. His current turbo is 30lb/min. This will yield an approximate 200 hp gain (all things being fair and equal in the world of physics). Customer A will go to a dyno, get his engine mapped, and there will be a before and after chart representing the difference in power. He will see and feel the money that he spent. With 200 extra hp, maybe he’ll drop 2-3 seconds off his lap time. Maybe. That’s if the extra power doesn’t through the cars balance off, or over drive the tire, or over heat the brakes.
What happens if the customer is told that he can spend the same amount of money on a data system that could take 5.00 seconds off his lap time by using accelerometer data and driving line evaluation, potentially identify faulty sensors, potentially identifying an engine failure BEFORE it happens, and allow for peace of mind if all of the data looks great?
He’s going to go for the turbocharger.
The problem at hand is that there is no perceived direct correlation between data and performance. It’s unfortunate because, when used correctly, this couldn’t be further from the truth.
Now it’s probably obvious by reading the other content on my website that I sell data systems, and it would be great if you contacted me to talk about them in more detail. But, all bias aside, they really are useful pieces of equipment that sometimes can result in the dramatic lap time reduction mentioned above, among other useful purposes.
Thoughts on being emotionless.
There’s such a nice feeling associated with making decisions based off of objective data. It completely removes the need for “emotion” or “feelings”. In the context of engine mapping, this concept couldn’t be more true and to the point. Imagine you’re sitting in the drivers seat of a 1000 hp Supra strapped to the dyno and you’ve just started a pull in 4th gear. You’ve got a lot going through your mind. “Does this engine have a coolant leak?” “Does it actually have E85 in it, or is it diesel?” “What’s that sound? Rod knock? Valve tap? Oil spraying out of the cylinder head?” The list goes on and on. And then you’ve got the normal stuff you’re supposed to look at like lambda, fuel pressure, temps, etc…
How to remove some of those points of concern:
-If you have cooling system pressure sensors, you can derive if theres a leak, or if you have a head gasket that’s starting to leak, or leaking profusely.
-If you have an ethanol content analyzer, you can tell exact ethanol content and not have to worry if you’ve got winter blend E60 or E70 as opposed to the E85 that you should have.
-Oil pressure sensors in different points of the engine can tell you a lot about the oil system efficiency or if there’s any oil in the engine at all (…)
The more you can do to remove these questions, the more mental focus you can apply to doing the original job of calibrating the engine. Furthermore, you can set up safe guards with good ECU’s that can impose a fuel cut, a warning light, or a boost reduction if any number of things are out of your specified range.
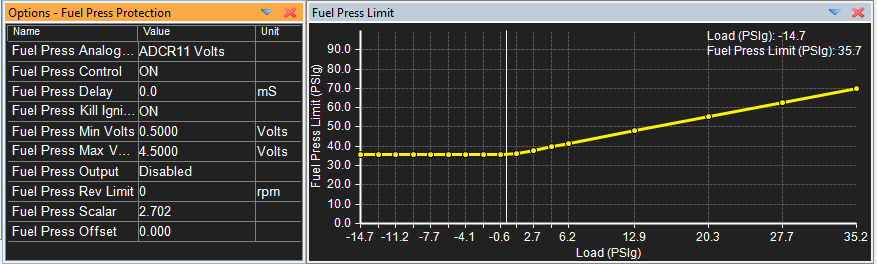
See below for an example. In this instance the AEM V2 ECU’s allow you to create a predicted path for fuel and oil pressure. It’s pretty simple but cleanly executed. Oil pressure changes with engine speed and thus, you can create a low oil pressure threshold at different RPM’s to compensate for that. I.E. if the oil pressure drops below x oil pressure at y rpm, the engine will cut for a brief period of time. Same goes with fuel pressure. At different manifold pressures, 1:1 fuel pressure regulators allow for 1 pound more fuel pressure for each 1 pound of manifold pressure (a calculated differential fuel pressure channel would remove this requirement entirely, but that’s maybe for another article, some day). As manifold pressure rises, so does the fuel pressure low threshold.
Just realized that I’m rambling a little bit, sorry.
So, I’ve explained how extra sensors or a data analysis package could help someone like me (who is someone who maps engines, regularly). Unless you’re like me, this probably doesn’t interest you tremendously.
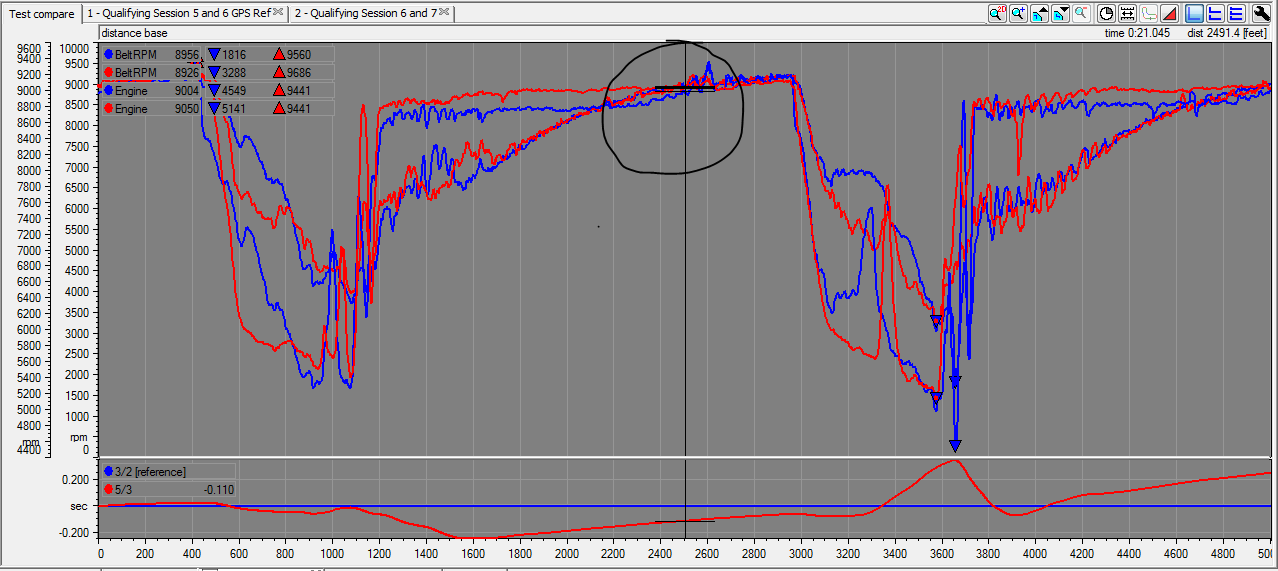
A thing that is tremendously useful for road racer types is the time difference graph. Have you ever wondered if you’re making an improvement on track? Or even better, exactly where? Practically all worthwhile GPS based data systems give you this information. Attached below is a screen shot of two laps overlayed on each other.

The upper graph is a representation of transmission speed, and engine speed, from two separate laps. The lower graph is the time difference graph. The blue line represents the faster lap time and it is used as the reference. The red line is the slower lap time. Since these two are overlayed based on distance, they are equally located based on position. This allows for an easy representation of EXACTLY WHERE you’re gaining or losing time. If the red value is positive the vehicle is losing time over the faster lap, if the red value is negative, the vehicle is gaining time (going quicker) over the faster lap.
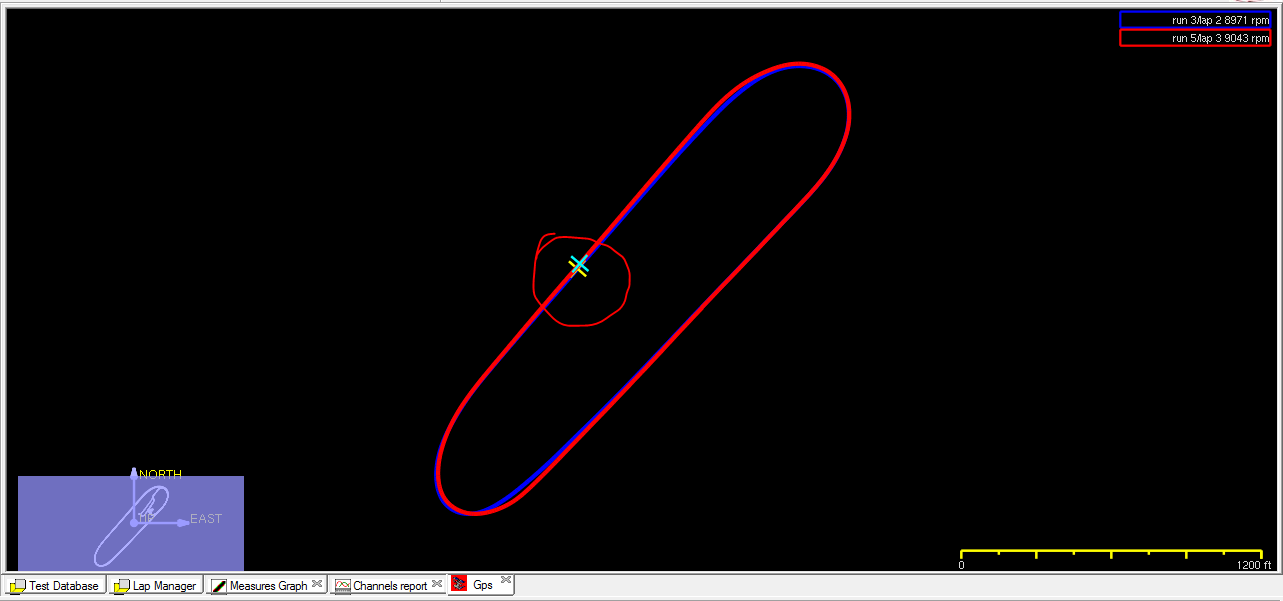
Even cooler than this, is that the software will auto generate a track map based off of GPS position. And since all of the data is located based on GPS coordinates you can select anywhere in the data and it will show up exactly where you’re at on the track at that particular data point.
So for example, the black circled area signifies where the cursor is selecting data.
Now all you need to do is to transfer over to the GPS track map and you will have an exact identification of where on track the selected data is correlated to. Neat.
Now take a few minutes to think about the usefulness of all of this information…
GPS based data systems can start around $1200.00. Fully featured GPS based dash loggers can start around $2500.00. (Be sure to ask me about all of the other functions that the dash loggers that I sell (from MoTeC) can do.
Pretty affordable if you really think about it.
Please feel free to email me any questions you might have. I’d love to chat.